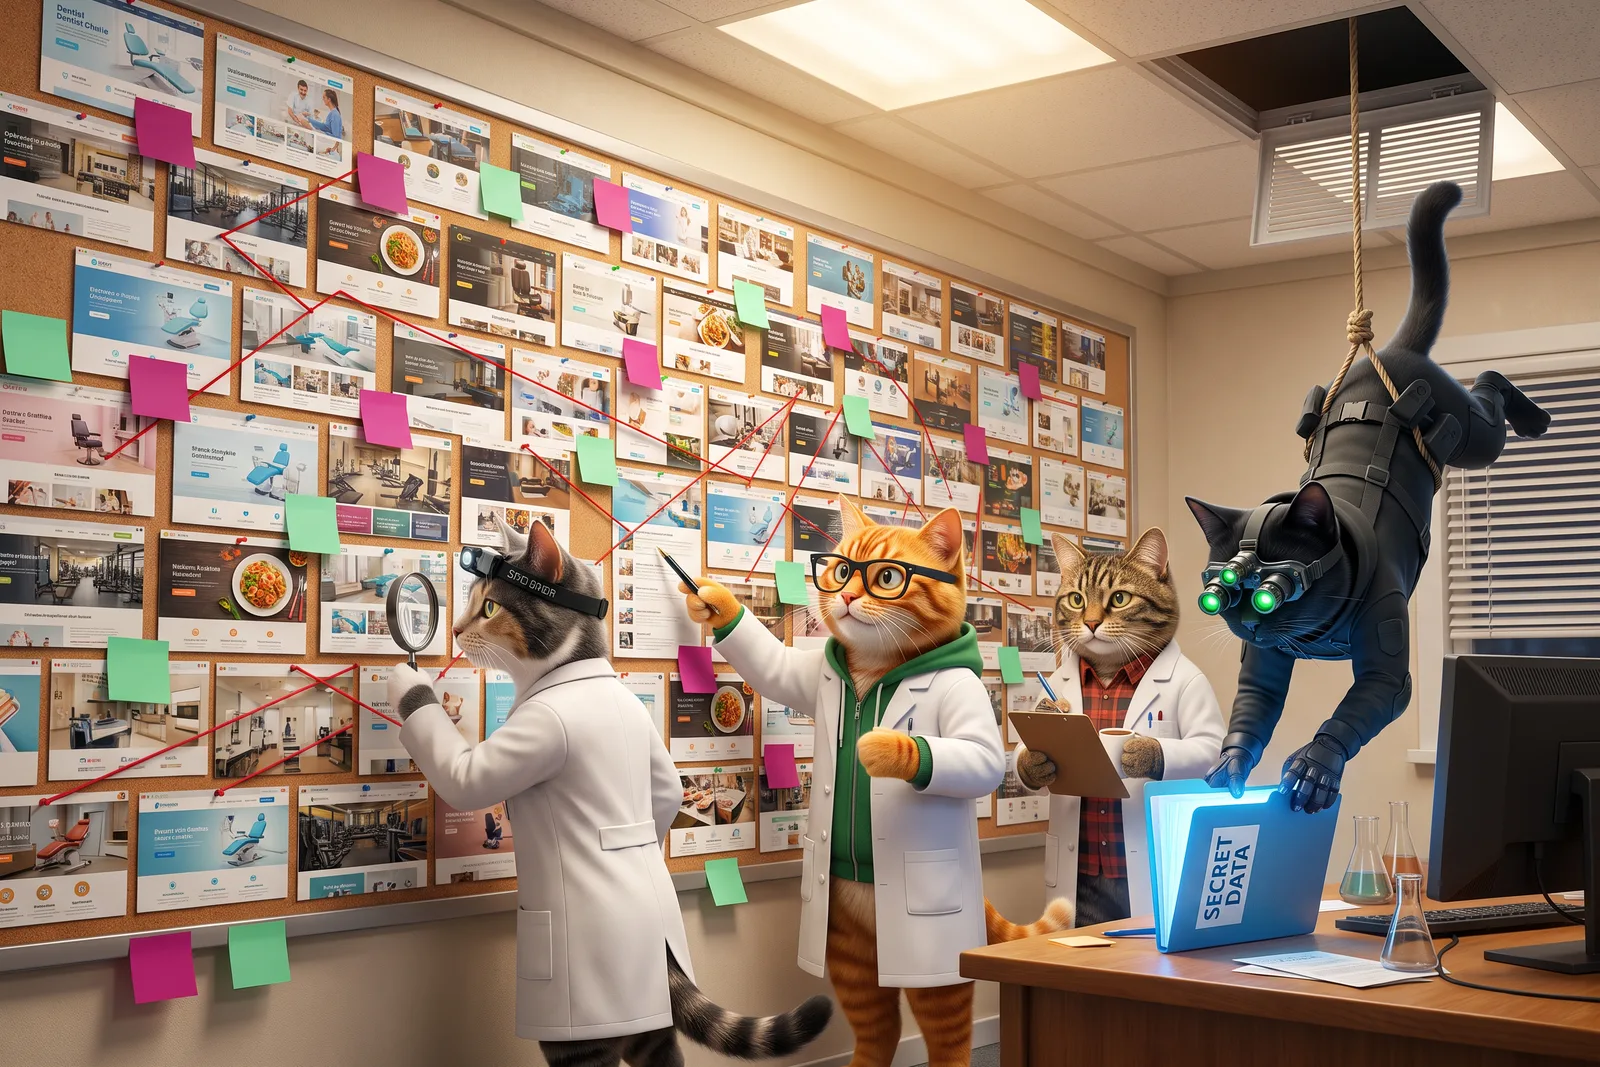
Meet Clikiti Research: open data on how small-business websites treat the people who use them
Most people meet a local business through its website first, yet almost nobody measures those websites in the open. Clikiti Research does: 20 reports and 3,210 websites so far, free to use under CC BY 4.0. Here is why we do it, where it is going, and how to work with us.
- Clikiti Research publishes free, open reports on small-business websites, one industry at a time: 20 reports covering 3,210 websites in its first round (Clikiti Research, October 2026).
- Every report, its data and its method are free to use and cite under CC BY 4.0, as HTML, PDF, Markdown, CSV and JSON, and AI tools are welcome to read them.
- The goal is a shared, measurable picture of how websites treat the people who use them, from contact details and accessibility to booking, forms and checkout, refreshed every quarter.
Before most people call a dentist, book a haircut or tour a school, they look at the business's website, usually on a phone. That first visit decides a lot. Yet the websites of small and local businesses are almost never measured in the open. Big brands get user research teams and conversion studies. The independent clinic, the family law firm and the corner gym get guesses.
Clikiti Research exists to change that. We scan small-business websites one industry at a time, the way a real customer meets them, and we publish what we find for anyone to use.
What we have done so far#
In our first round we published 20 reports covering 3,210 websites, from private schools and law firms to salons, moving companies and wedding venues. Each report reads every site the way a new customer does: on a phone, with the questions that customer asks first.
For every site we check four things:
- Can people use it? Clear wording, consistent navigation and the details a customer looks for before they call.
- Can everyone use it? Automated WCAG 2.2 AA checks such as colour contrast, image descriptions and form labels.
- Is it fast on a phone? Page weight, requests and load time, from lab runs and real-user field data where it exists.
- Does it answer the customer? Questions written for each industry, such as whether a salon states its cancellation policy or a school shows what it costs.
Every number in a report comes from the scans. Every report shows its method, its sample size and its margin of error, and ends with the list of sites in the study and a way for any business to ask to be removed.
Where this is going#
A single report is a snapshot. A series becomes a science. We are building toward a shared, measurable picture of how websites treat the people who use them, and we want it to grow in three directions.
From what a page says to what people do. Today our checks read what a site shows. Next we want to understand interaction: how many taps it takes to book, where a form loses people, what happens when a visitor makes a mistake. That is the work our forms and QA agent already does on a small scale, and it is the core of good usability research.
From local services to commerce. The same questions apply to online shops: can a customer find the price, the delivery cost and the return policy before checkout, and can they finish the purchase on a phone? E-commerce is a natural next step for the reports.
From snapshots to trends. We plan to refresh every industry each quarter. Over time that shows what actually changes when a business fixes its site, which fixes spread through an industry, and where whole sectors stay stuck. Long-term, public data like this is how the field learns what works instead of repeating rules of thumb.
We will be careful as we go. Our data describes websites, not people, and we will keep it that way.
Open by default#
Everything we publish is free to use under CC BY 4.0. Quote it, chart it, teach with it or build on it, and credit Clikiti Research with a link. Every report comes as a web page, a PDF, Markdown, and CSV and JSON data files, and our llms.txt points AI tools to all of it. We welcome AI assistants that read and cite the reports; that is part of the point.
If you run a business that appears in a study and want to be left out, every report has a "Remove my site from this study" link. We review each request and reply when it is done.
Meet the research team#
Every Clikiti scan is run by four automated agents, and each has a cat as its mascot and its own temperament. You may know them from clikiti.com.
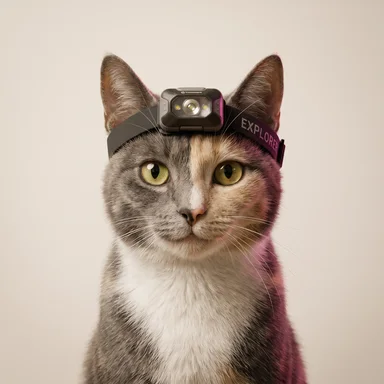 WhiskersUsability researcherThe curious one. Explores slowly, reads every label and alt text, follows every link and notes the friction a first-time visitor feels. Checks pages against usability heuristics.
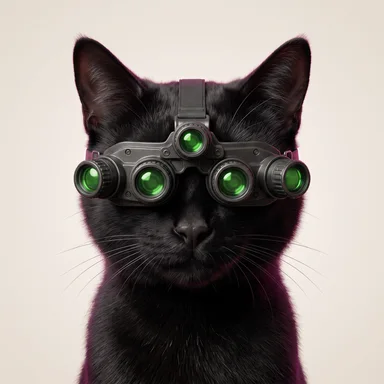 ShadowAccessibility researcherThe sneaky one. Looks where nobody looks: colour contrast, missing image descriptions, form labels and the edge cases that lock real people out. Checks against WCAG 2.2 AA.
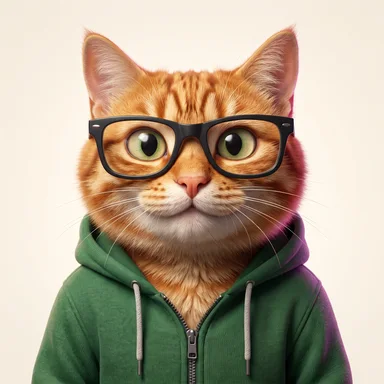 TigerSpeed researcherThe aggressive one. Loads every page on a phone and weighs it: page weight, requests, heavy images and how long a visitor waits. Reads Lighthouse and real-user field data.
 PawsForms and QA researcherThe clumsy one. Fat-fingers everything: double-submits forms, taps the wrong button and finds out what breaks when real humans arrive. Checks booking, contact and checkout flows.
The cats do the scanning. The research itself, the questions, the checks against the evidence and the writing, is done by people at Clikiti, led by our founder Javier Alcivar. We are a small, friendly team, and we read every message.
Work with us#
We would love to hear from you if you are:
- a researcher, teacher or student who wants the data for a study, a class or a thesis;
- a journalist looking for numbers on a local industry;
- an agency or freelancer who wants a report on an industry or a region we have not covered;
- a tool maker or platform that wants to compare notes or run a joint study.
Write to hello@clikiti.com and tell us what you have in mind. No forms, no sales call unless you ask for one. If you want to see what the scans look like on your own site first, run a free scan on clikiti.com.
More about who we are and how we work is on the About Clikiti Research page.
Keep reading
More on inside clikiti research and the same problems in other industries



How to cite
Clikiti Research (2026, October 16). Meet Clikiti Research: open data on how small-business websites treat the people who use them. Clikiti. https://splash.clikiti.com/research/posts/meet-clikiti-research
Data and license
Free to reuse under CC BY 4.0. Credit Clikiti with a link. Plain Markdown
About the images
People in the photographs on this page are AI-generated. No real person, school, firm or practice is shown. Last updated Oct 16, 2026.
One stat. One pitch. Every Tuesday.
A finding from our scans, what it means for the agencies selling to that industry, and the line to open a pitch with. Free.